Planning & Scheduling
Logic-driven baseline schedules with approved WBS, resource & cost loading. Critical path, float analysis and recovery planning using Primavera P6 and MS Project.
Learn MoreProfessional project management, planning, control and reporting services designed for the world's most complex and demanding projects.

What We Offer
We provide end-to-end project management support focused on planning, scheduling, monitoring, control and reporting across the full project lifecycle.
Logic-driven baseline schedules with approved WBS, resource & cost loading. Critical path, float analysis and recovery planning using Primavera P6 and MS Project.
Learn MoreMonitor progress, manage resources and identify risks early. Structured progress reports aligned with industry best practices and client requirements.
Learn MoreImplement Earned Value Management — EV, PV, AC, SPI, CPI and EAC analysis — providing objective performance measurement and early variance detection.
Learn MoreExecutive management dashboards, S-curves, histograms and structured progress reports for clear visibility of trends, risks and corrective actions.
Learn MoreSpecialised program management consultancy for complex Oil & Gas, Power, Mining, Renewable Energy and Infrastructure projects — globally.
Get in TouchExpert P6 implementation, troubleshooting, schedule quality reviews, critical path analysis and tailored training for your project team.
Get in TouchHow It Works
A structured, repeatable process that ensures consistent, high-quality outcomes on every engagement.
Review project scope, objectives, constraints and client reporting requirements.
Develop baseline schedule in P6, load resources, costs and establish WBS structure.
Track progress, measure EVM metrics and identify variances against baseline.
Deliver dashboards, S-curves and reports to support informed decision-making.
Knowledge Hub
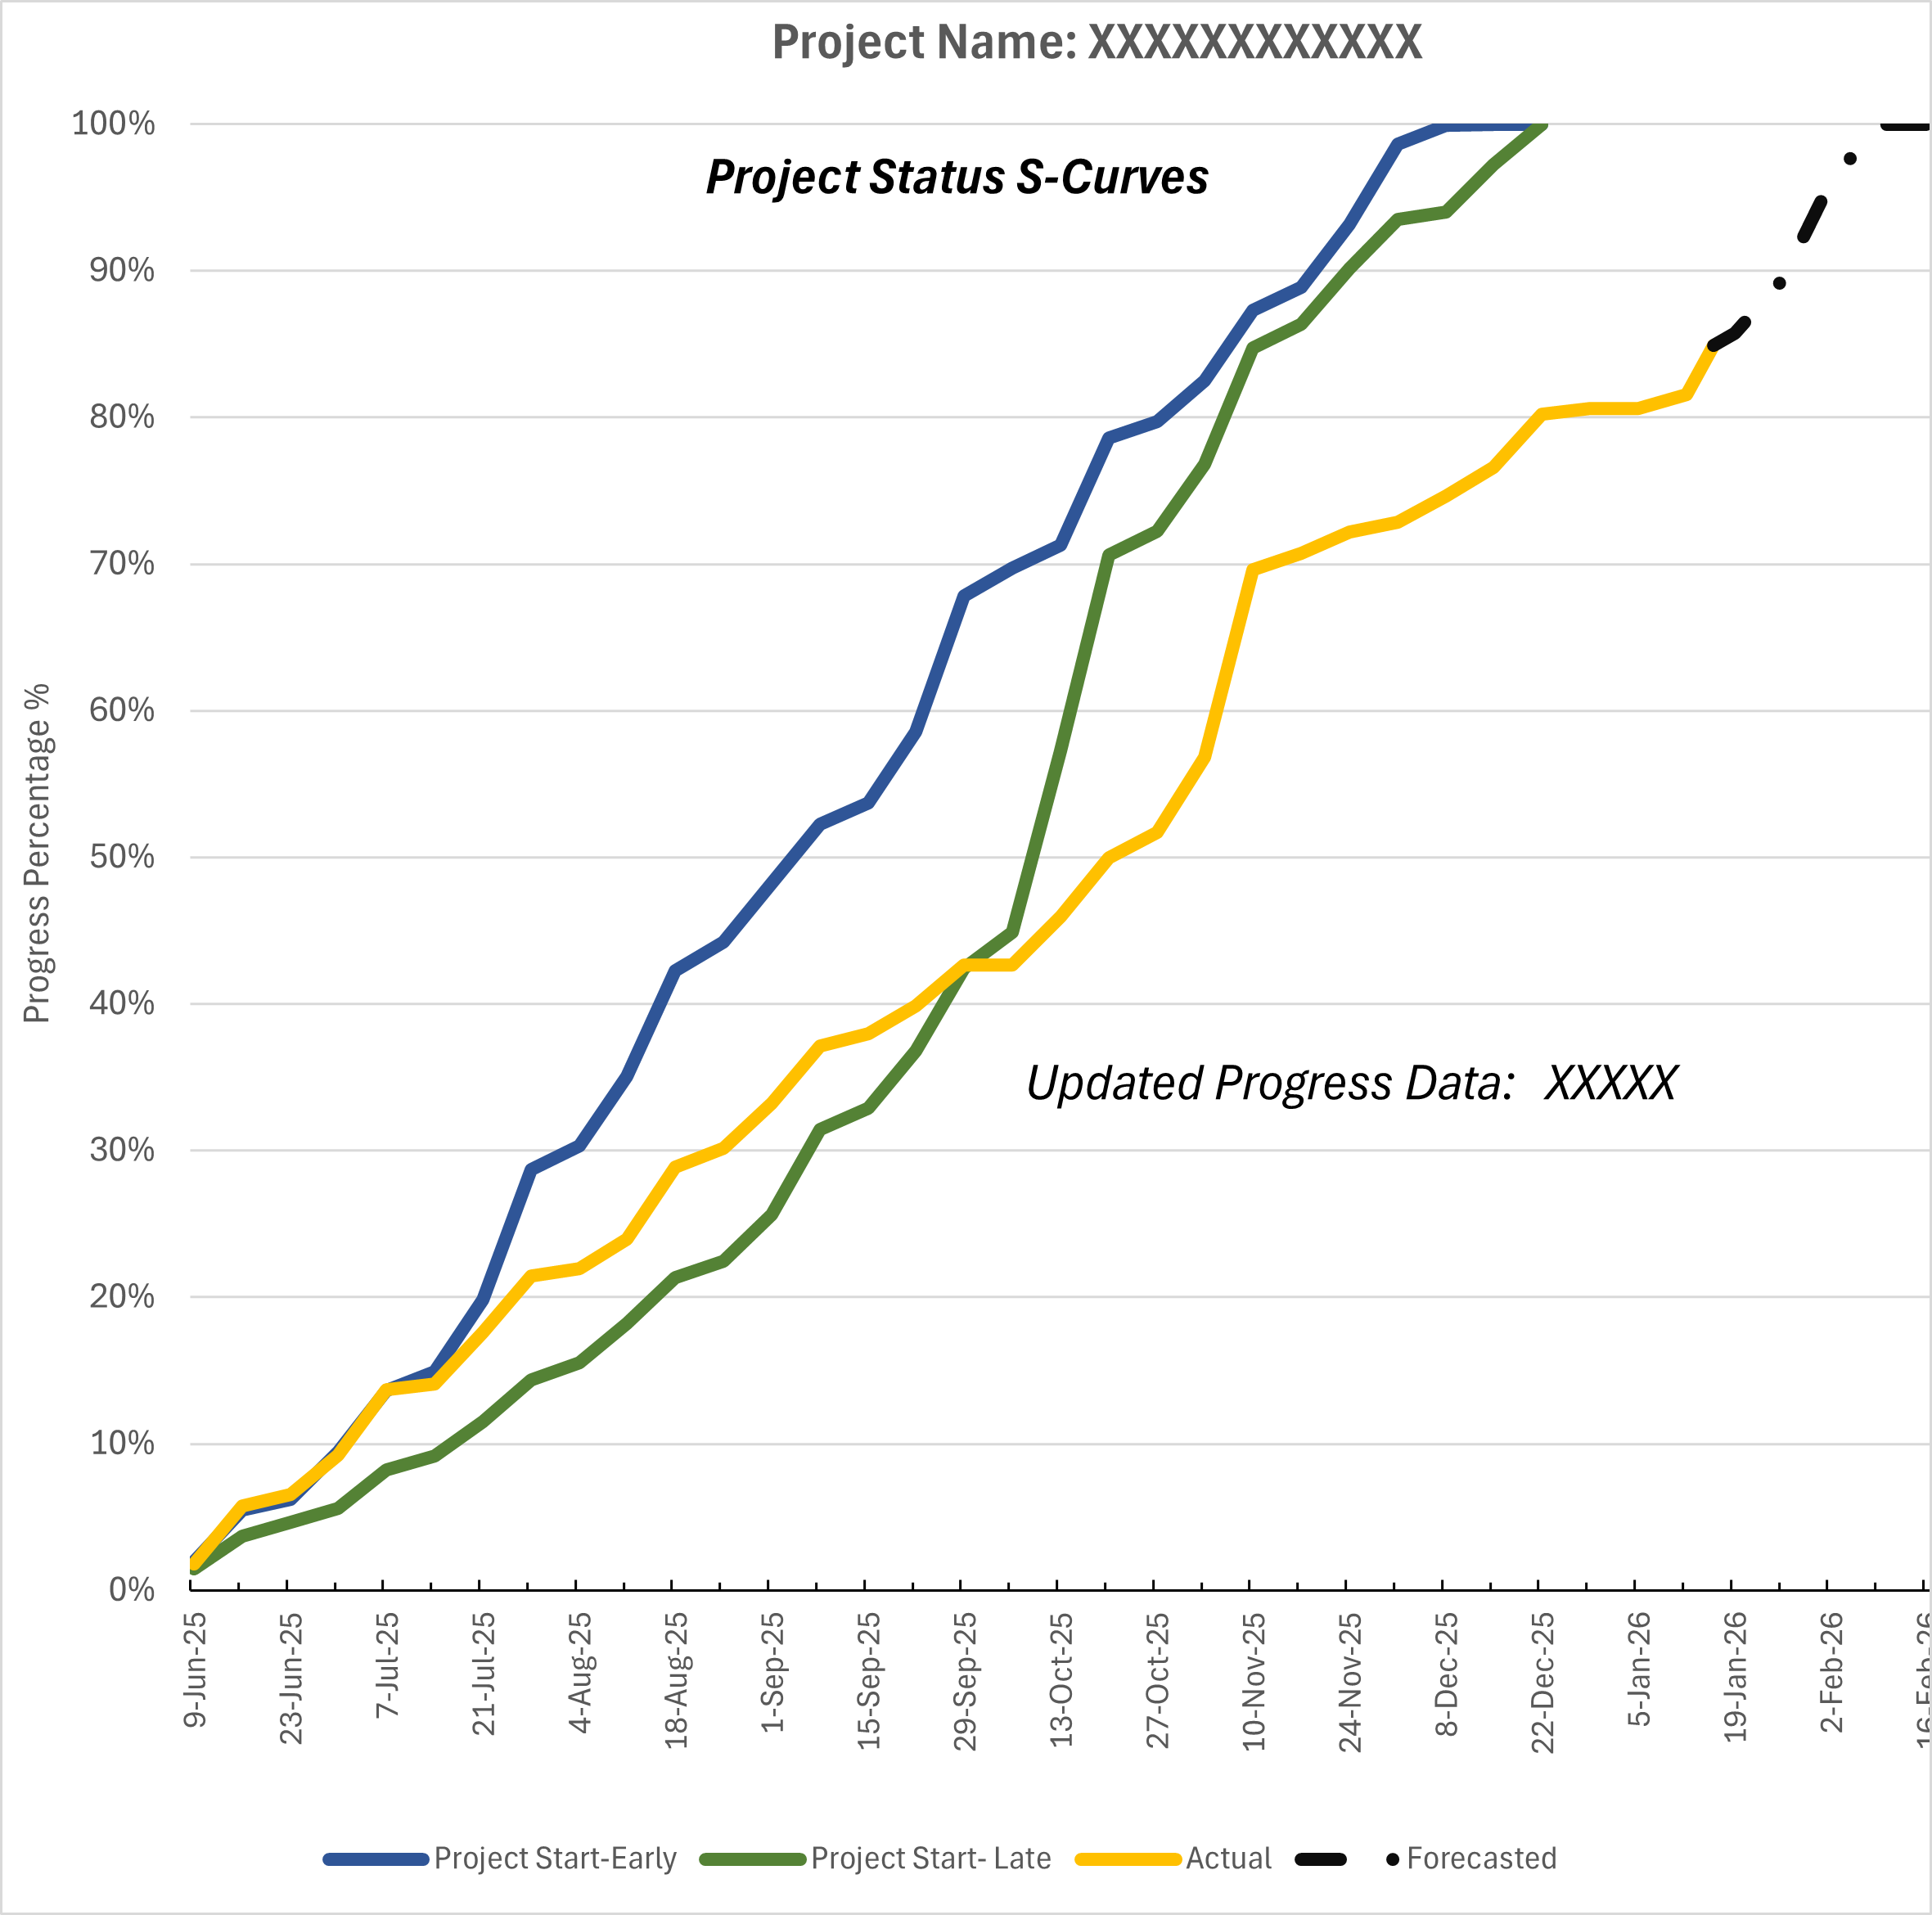
An S-Curve is a chart that shows how a project grows over time. It starts slowly, accelerates in the middle phase, and tapers near completion — forming a distinctive "S" shape.
The horizontal axis represents time, while the vertical axis shows cumulative work, cost or progress completed. By plotting both planned and actual progress, project managers gain a powerful visual tool.
Knowledge Hub
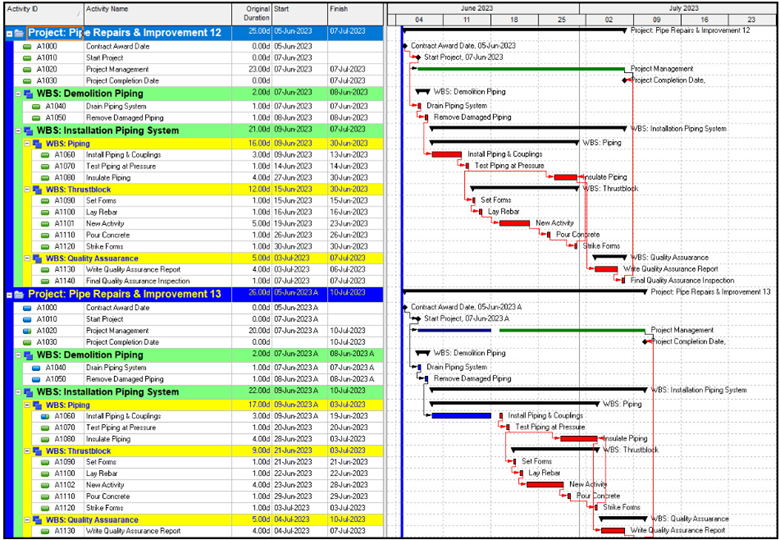
A Gantt Chart is a visual timeline used to plan and manage a project. It shows all tasks, their durations, dependencies and milestones in a single, easy-to-read format.
As work progresses, the chart is updated to reflect actual vs planned progress — giving teams and clients a clear picture of where the project stands at any point in time.
Knowledge Hub
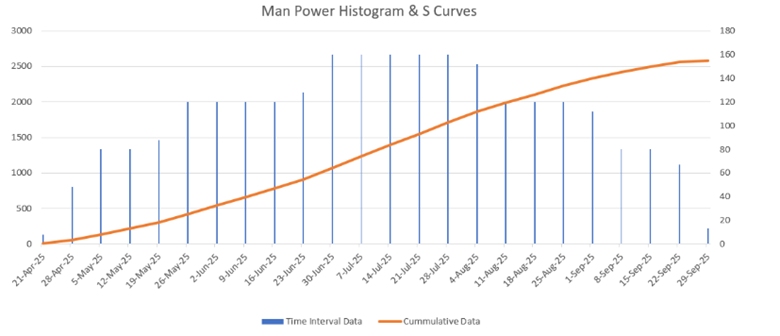
A visual tool that shows how many workers are needed at each stage of a project — enabling smarter workforce planning and cost control.
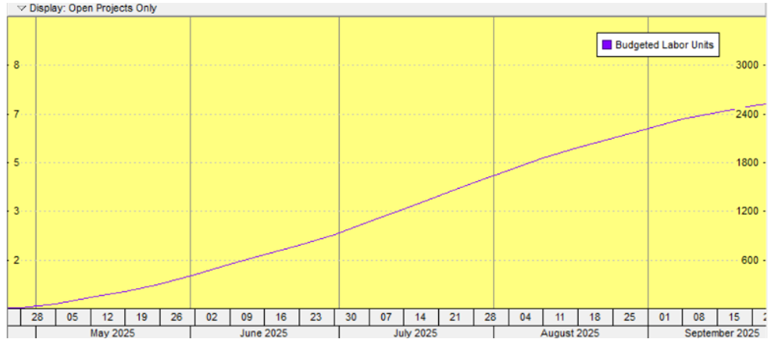
A Manpower Histogram is a bar chart that visualises workforce demand over time. In Primavera P6, it is generated through the Resource Usage Profile — mapping the number of workers required for each project period.
This allows project managers to proactively plan labour, avoid costly over- or under-staffing, and ensure the right people are on site at the right time.
Knowledge Hub
EVM is an industry-standard project performance measurement methodology that integrates scope, schedule and cost — providing an objective picture of project health at any point in time.
We implement EVM in accordance with client and industry requirements, giving leadership the data they need to make informed decisions and take timely corrective action.
Our Tech Stack
Industry-leading software platforms used by our team to deliver precise, reliable project controls.
Our Track Record
Let us help you plan, control and deliver your project on time and within budget.